Integrating Multiple Datasets
In this tutorial, we will integrate two related samples together.
[1]:
import stlearn as st
import scanpy as sc
import numpy as np
import harmonypy as hm

st.settings.set_figure_params(dpi=150)
/Users/andrew/conda/stlearn/lib/python3.10/site-packages/louvain/__init__.py:54: UserWarning: pkg_resources is deprecated as an API. See https://setuptools.pypa.io/en/latest/pkg_resources.html. The pkg_resources package is slated for removal as early as 2025-11-30. Refrain from using this package or pin to Setuptools<81.
  from pkg_resources import get_distribution, DistributionNotFound
/Users/andrew/conda/stlearn/lib/python3.10/site-packages/stlearn/tl/cci/het.py:206: NumbaDeprecationWarning: The keyword argument 'nopython=False' was supplied. From Numba 0.59.0 the default is being changed to True and use of 'nopython=False' will raise a warning as the argument will have no effect. See https://numba.readthedocs.io/en/stable/reference/deprecation.html#deprecation-of-object-mode-fall-back-behaviour-when-using-jit for details.
  @jit(parallel=True, nopython=False)
Read data
In this tutorial, we are using the Breast cancer datasets with 2 sections of block A.
Source:
https://www.10xgenomics.com/datasets/human-breast-cancer-block-a-section-1-1-standard-1-1-0 and
https://www.10xgenomics.com/datasets/human-breast-cancer-block-a-section-2-1-standard-1-1-0
[2]:
block1 = sc.datasets.visium_sge(sample_id="V1_Breast_Cancer_Block_A_Section_1")
block1 = st.convert_scanpy(block1)
/Users/andrew/conda/stlearn/lib/python3.10/site-packages/anndata/_core/anndata.py:1758: UserWarning: Variable names are not unique. To make them unique, call `.var_names_make_unique`.
  utils.warn_names_duplicates("var")
/Users/andrew/conda/stlearn/lib/python3.10/site-packages/anndata/_core/anndata.py:1758: UserWarning: Variable names are not unique. To make them unique, call `.var_names_make_unique`.
  utils.warn_names_duplicates("var")
[3]:
block2 = sc.datasets.visium_sge(sample_id="V1_Breast_Cancer_Block_A_Section_2")
block2 = st.convert_scanpy(block2)
/Users/andrew/conda/stlearn/lib/python3.10/site-packages/anndata/_core/anndata.py:1758: UserWarning: Variable names are not unique. To make them unique, call `.var_names_make_unique`.
  utils.warn_names_duplicates("var")
/Users/andrew/conda/stlearn/lib/python3.10/site-packages/anndata/_core/anndata.py:1758: UserWarning: Variable names are not unique. To make them unique, call `.var_names_make_unique`.
  utils.warn_names_duplicates("var")
Processing data
[4]:
# concatenate 2 samples
adata_concat = block1.concatenate(block2)
/var/folders/j9/xg__c_rx4jdgzs2r1dqd43hr0000gn/T/ipykernel_42354/2872907640.py:2: FutureWarning: Use anndata.concat instead of AnnData.concatenate, AnnData.concatenate is deprecated and will be removed in the future. See the tutorial for concat at: https://anndata.readthedocs.io/en/latest/concatenation.html
  adata_concat = block1.concatenate(block2)
[5]:
# Preprocessing
# Filter genes
sc.pp.filter_genes(adata_concat, min_cells=3)
# Normalize data
sc.pp.normalize_total(adata_concat, target_sum=1e4)
# Log transformation
sc.pp.log1p(adata_concat)
# Store raw data
adata_concat.raw = adata_concat
# Extract top highly variable genes
sc.pp.highly_variable_genes(adata_concat, min_mean=0.0125, max_mean=3, min_disp=0.5)
adata_concat = adata_concat[:, adata_concat.var.highly_variable]
# Scale data
sc.pp.scale(adata_concat, max_value=10)
OMP: Info #276: omp_set_nested routine deprecated, please use omp_set_max_active_levels instead.
/Users/andrew/conda/stlearn/lib/python3.10/site-packages/scanpy/preprocessing/_scale.py:318: UserWarning: Received a view of an AnnData. Making a copy.
  view_to_actual(adata)
[6]:
# Run dimensionality reduction
sc.pp.pca(adata_concat, n_comps=30, svd_solver='arpack')
Run integration with harmony
[7]:
# Prepare metadata and PCA
meta_data = adata_concat.obs
data_mat = adata_concat.obsm["X_pca"]
[8]:
# Run harmony
ho = hm.run_harmony(data_mat, meta_data, "batch")
2025-07-07 13:48:39,174 - harmonypy - INFO - Computing initial centroids with sklearn.KMeans...
2025-07-07 13:48:39,840 - harmonypy - INFO - sklearn.KMeans initialization complete.
2025-07-07 13:48:39,853 - harmonypy - INFO - Iteration 1 of 10
2025-07-07 13:48:40,334 - harmonypy - INFO - Iteration 2 of 10
2025-07-07 13:48:40,840 - harmonypy - INFO - Iteration 3 of 10
2025-07-07 13:48:41,357 - harmonypy - INFO - Iteration 4 of 10
2025-07-07 13:48:41,929 - harmonypy - INFO - Iteration 5 of 10
2025-07-07 13:48:42,415 - harmonypy - INFO - Iteration 6 of 10
2025-07-07 13:48:42,901 - harmonypy - INFO - Iteration 7 of 10
2025-07-07 13:48:43,099 - harmonypy - INFO - Iteration 8 of 10
2025-07-07 13:48:43,320 - harmonypy - INFO - Iteration 9 of 10
2025-07-07 13:48:43,518 - harmonypy - INFO - Iteration 10 of 10
2025-07-07 13:48:43,753 - harmonypy - INFO - Converged after 10 iterations
[9]:
# Mapping back the result to the adata object
adata_concat.obsm["X_pca"] = ho.Z_corr.T
Perform clustering and visualize the results by UMAP
[10]:
# Build KNN and run UMAP
sc.pp.neighbors(adata_concat, n_pcs=30)
sc.tl.umap(adata_concat)
[11]:
# Run clustering with leiden
sc.tl.leiden(adata_concat, resolution=0.4)
/var/folders/j9/xg__c_rx4jdgzs2r1dqd43hr0000gn/T/ipykernel_42354/3739456557.py:2: FutureWarning: In the future, the default backend for leiden will be igraph instead of leidenalg.

 To achieve the future defaults please pass: flavor="igraph" and n_iterations=2.  directed must also be False to work with igraph's implementation.
  sc.tl.leiden(adata_concat, resolution=0.4)
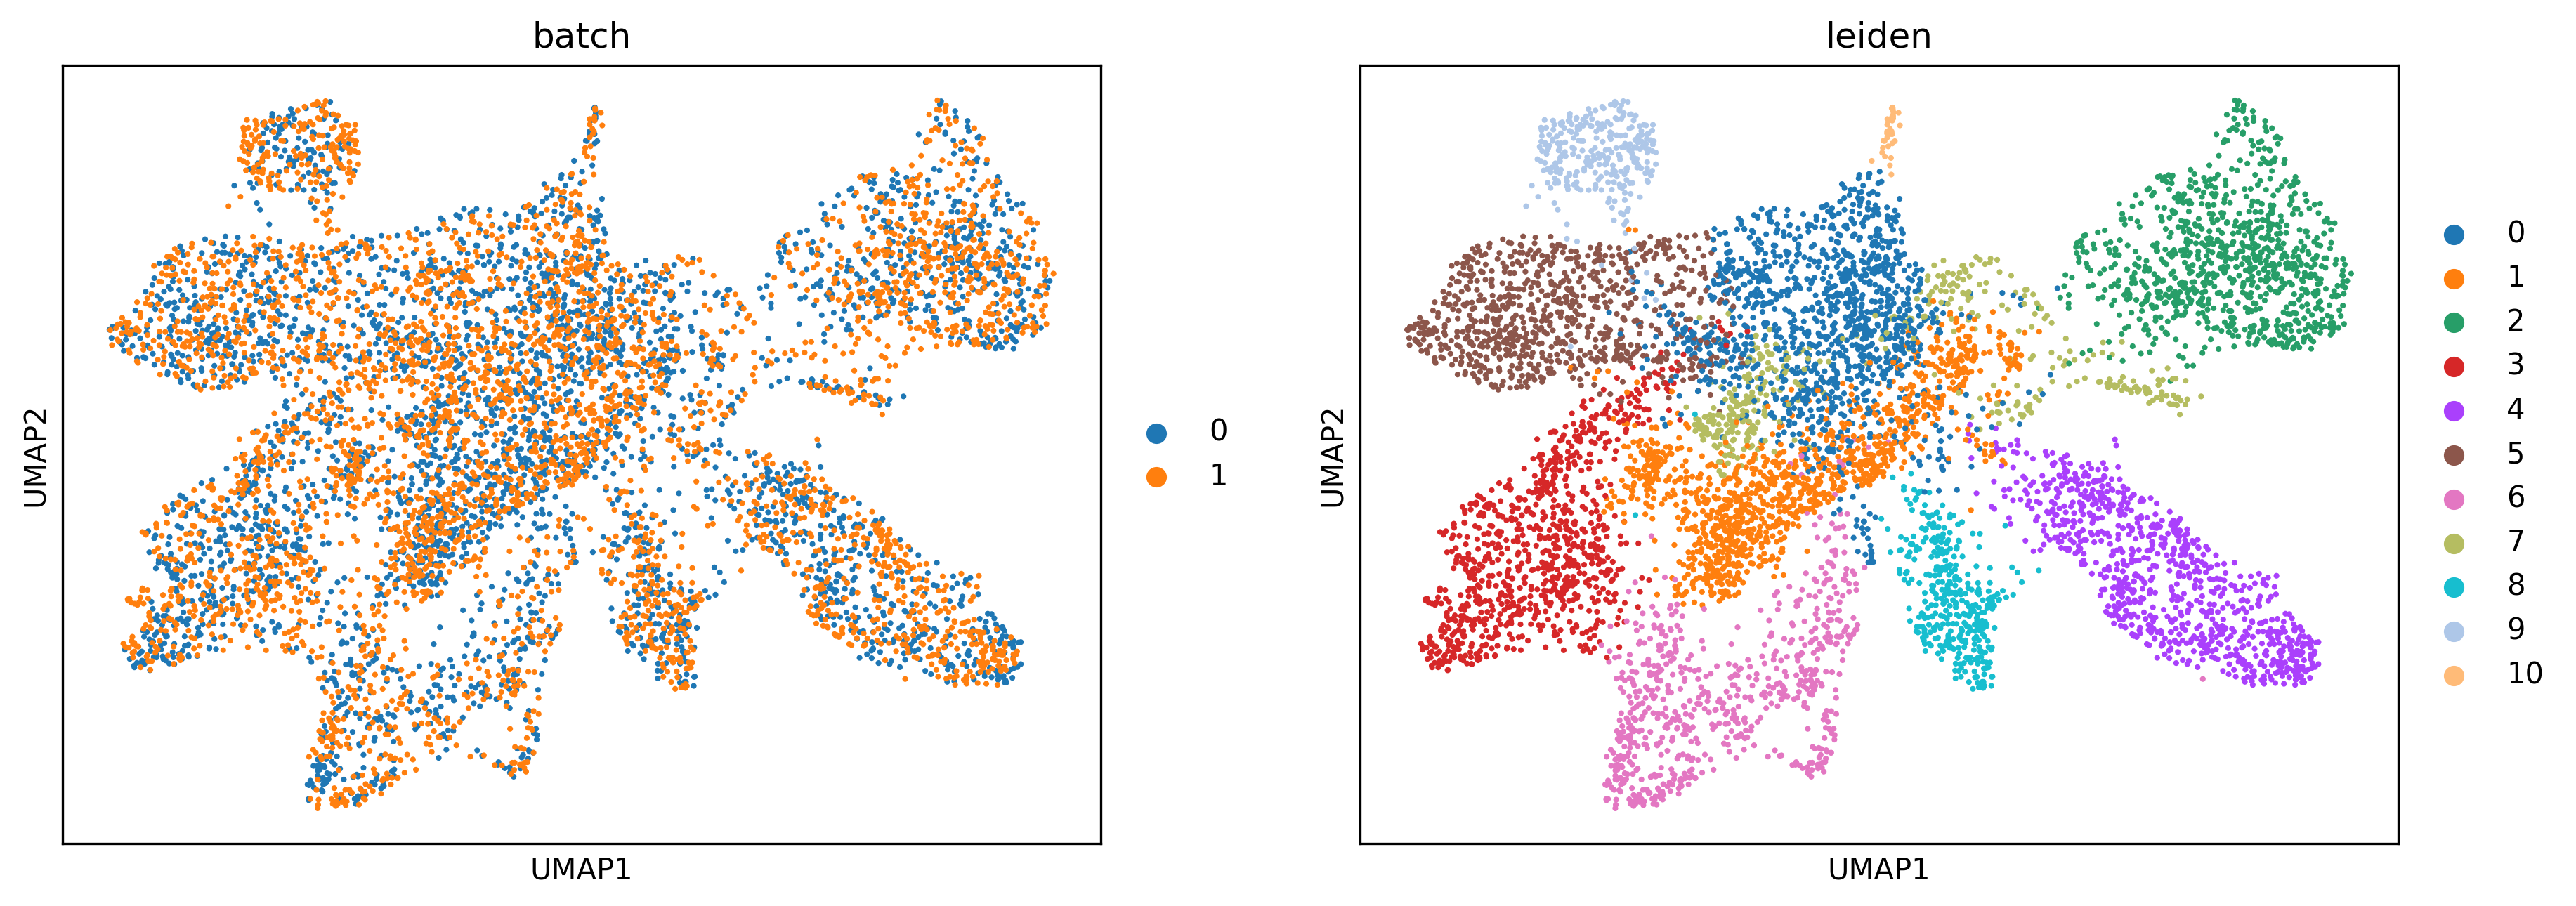
[12]:
# Plotting UMAP
sc.pl.umap(adata_concat, color=["batch","leiden"])
Map the result back to the original samples
[13]:
st.settings.set_figure_params(dpi=150)
# Map leiden clusteirng result to block A section 1
block1.obs["leiden"] = adata_concat.obs[adata_concat.obs.batch=="0"].leiden.values
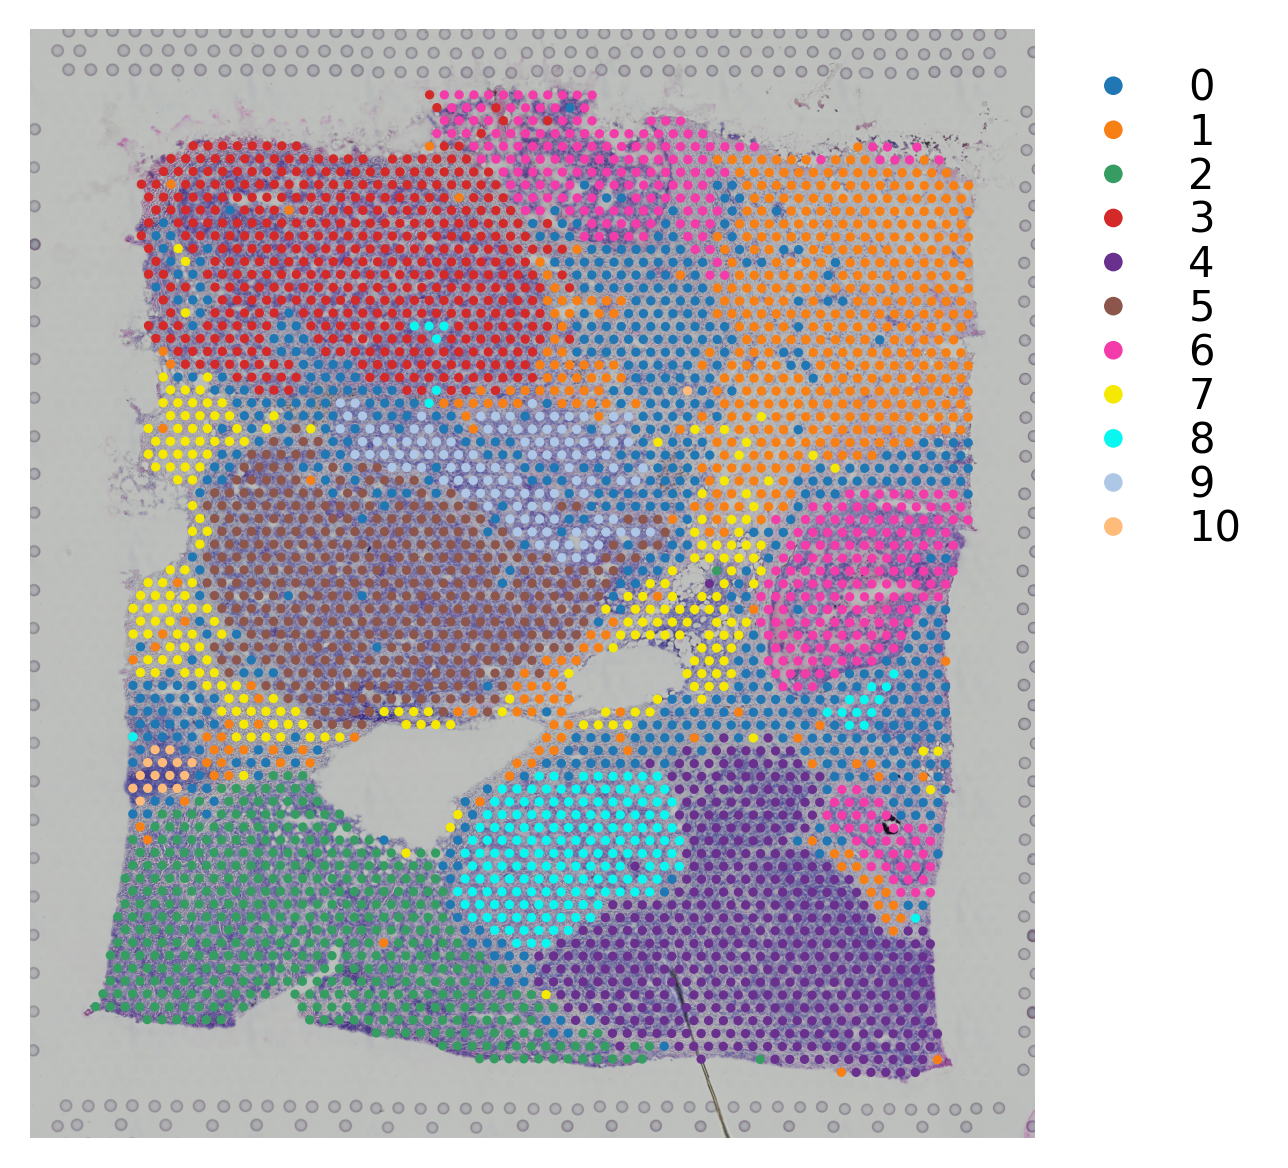
[14]:
# Plotting the clusteirng result
st.pl.cluster_plot(block1,use_label="leiden")
[14]:
AnnData object with n_obs × n_vars = 3798 × 36601
    obs: 'in_tissue', 'array_row', 'array_col', 'imagecol', 'imagerow', 'leiden'
    var: 'gene_ids', 'feature_types', 'genome'
    uns: 'spatial', 'leiden_colors'
    obsm: 'spatial'
[15]:
# Map leiden clustering result to block A section 2
block2.obs["leiden"] = adata_concat.obs[adata_concat.obs.batch=="1"].leiden.values
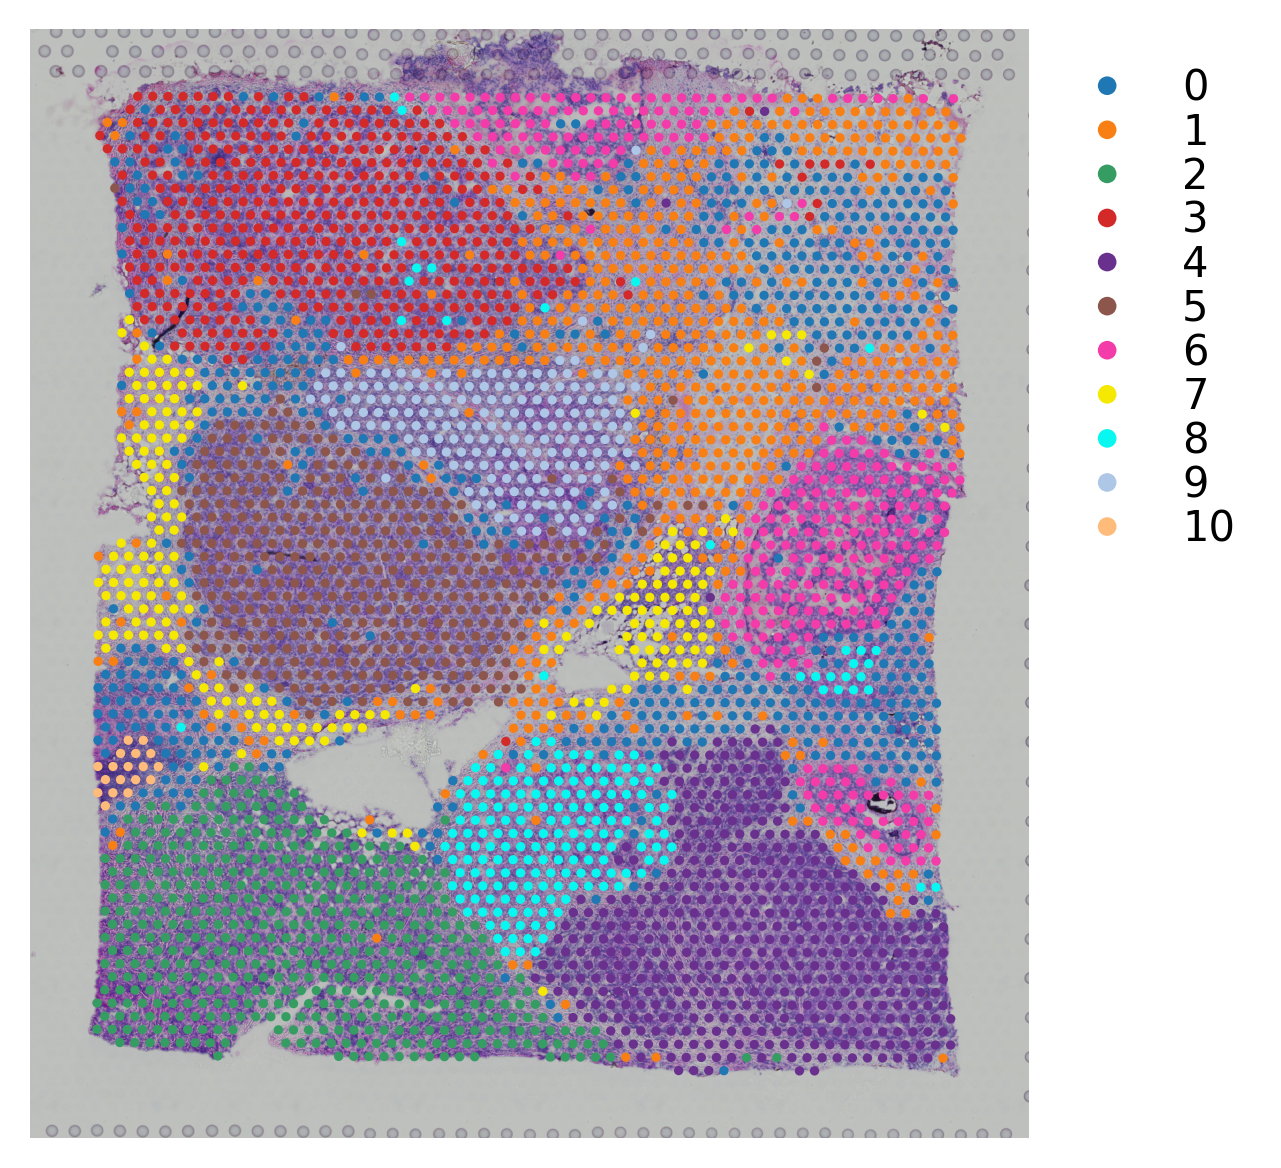
[16]:
# Plotting the clustering result
st.pl.cluster_plot(block2,use_label="leiden")
[16]:
AnnData object with n_obs × n_vars = 3987 × 36601
    obs: 'in_tissue', 'array_row', 'array_col', 'imagecol', 'imagerow', 'leiden'
    var: 'gene_ids', 'feature_types', 'genome'
    uns: 'spatial', 'leiden_colors'
    obsm: 'spatial'
Manually combine the images and change the coordinates
This is a way to plotting 2 samples in the same adata object.
[17]:
# Initialize the spatial
adata_concat.uns["spatial"] = block1.uns["spatial"]
[18]:
# Horizontally stack 2 images from section 1 and section 2 datasets
combined = np.hstack([block1.uns["spatial"]["V1_Breast_Cancer_Block_A_Section_1"]["images"]["hires"],
                      block2.uns["spatial"]["V1_Breast_Cancer_Block_A_Section_2"]["images"]["hires"]])
[19]:
# Map the image to the concatnated adata object
adata_concat.uns["spatial"]["V1_Breast_Cancer_Block_A_Section_1"]["images"]["hires"] = combined
[20]:
# Manually change the coordinate of spots to the right
adata_concat.obs.loc[adata_concat.obs.batch == "1","imagecol"] = adata_concat.obs.loc[adata_concat.obs.batch == "1","imagecol"].values + 2000
[21]:
# Change to the .obsm["spatial"]
factor = adata_concat.uns["spatial"]["V1_Breast_Cancer_Block_A_Section_1"]["scalefactors"]["tissue_hires_scalef"]
adata_concat.obsm["spatial"] = adata_concat.obs[["imagecol","imagerow"]].values / factor
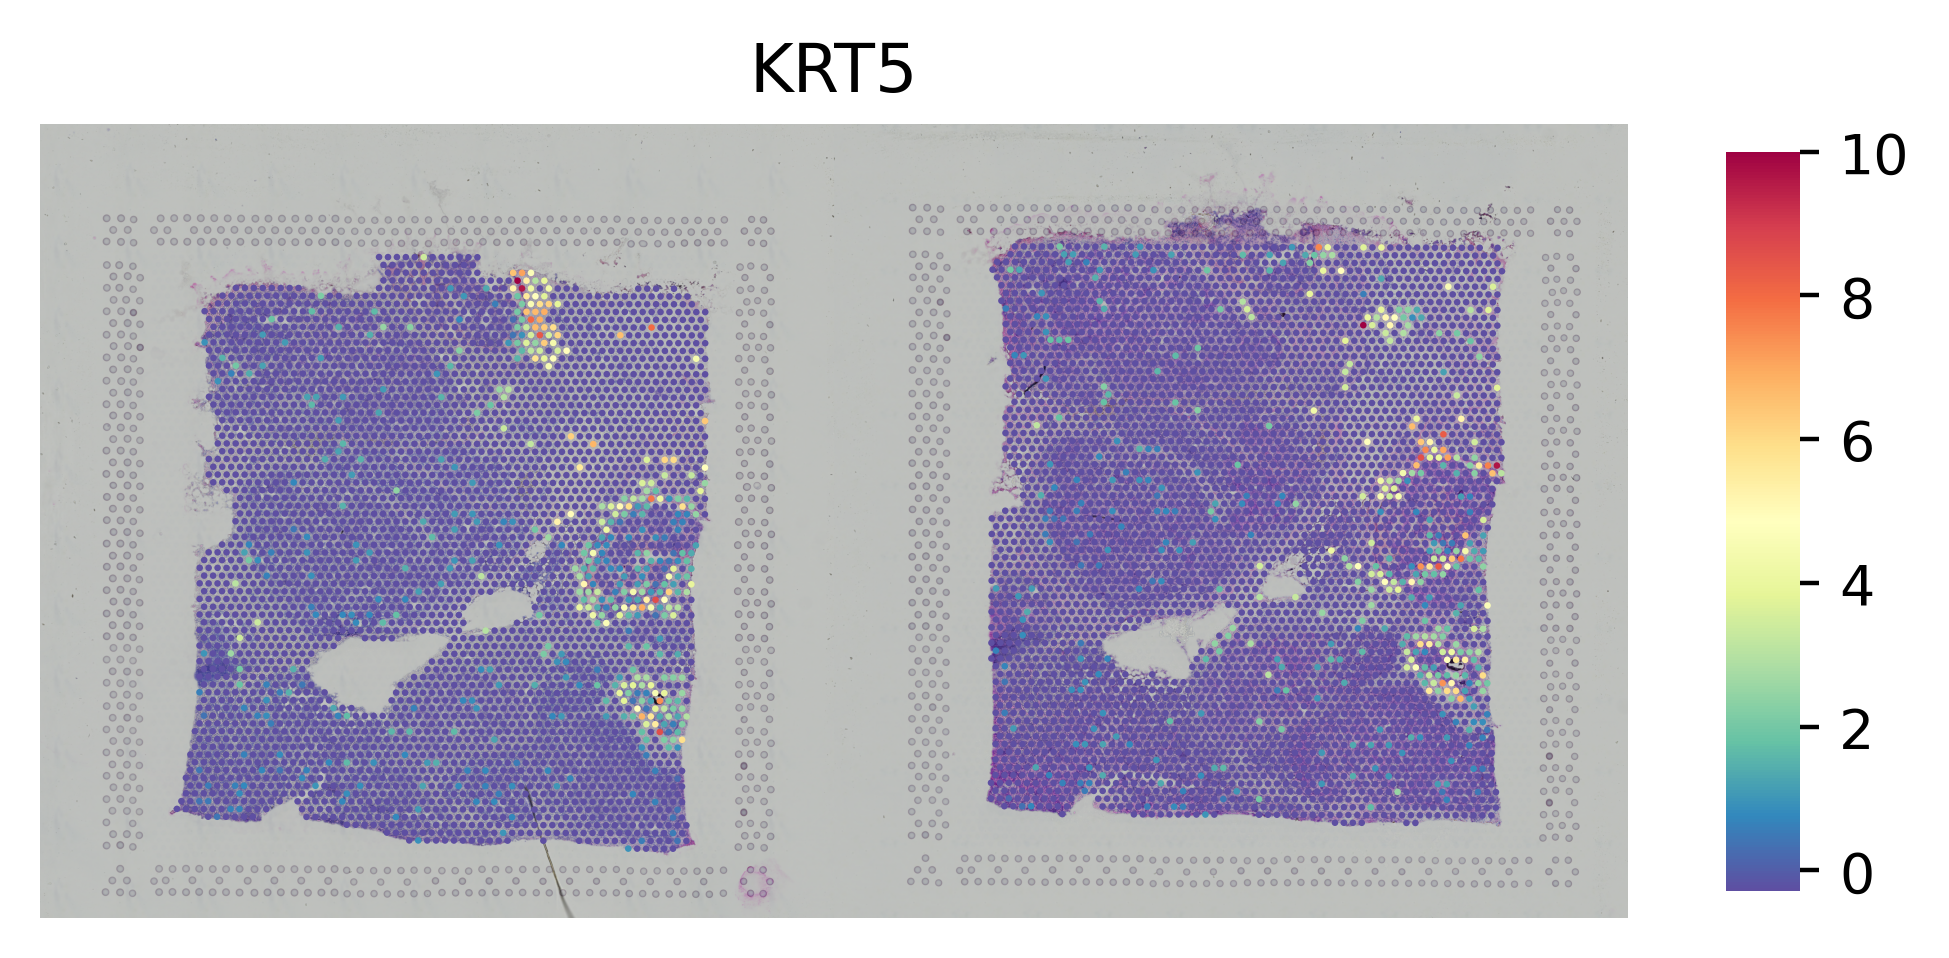
[22]:
st.settings.set_figure_params(dpi=200)
[23]:
# Plot the gene
st.pl.gene_plot(adata_concat, gene_symbols="KRT5",crop=False, size=1.4,cell_alpha=1)
[23]:
AnnData object with n_obs × n_vars = 7785 × 3018
    obs: 'in_tissue', 'array_row', 'array_col', 'imagecol', 'imagerow', 'batch', 'leiden'
    var: 'gene_ids', 'feature_types', 'genome', 'n_cells', 'highly_variable', 'means', 'dispersions', 'dispersions_norm', 'mean', 'std'
    uns: 'log1p', 'hvg', 'pca', 'neighbors', 'umap', 'leiden', 'batch_colors', 'leiden_colors', 'spatial'
    obsm: 'spatial', 'X_pca', 'X_umap'
    varm: 'PCs'
    obsp: 'distances', 'connectivities'
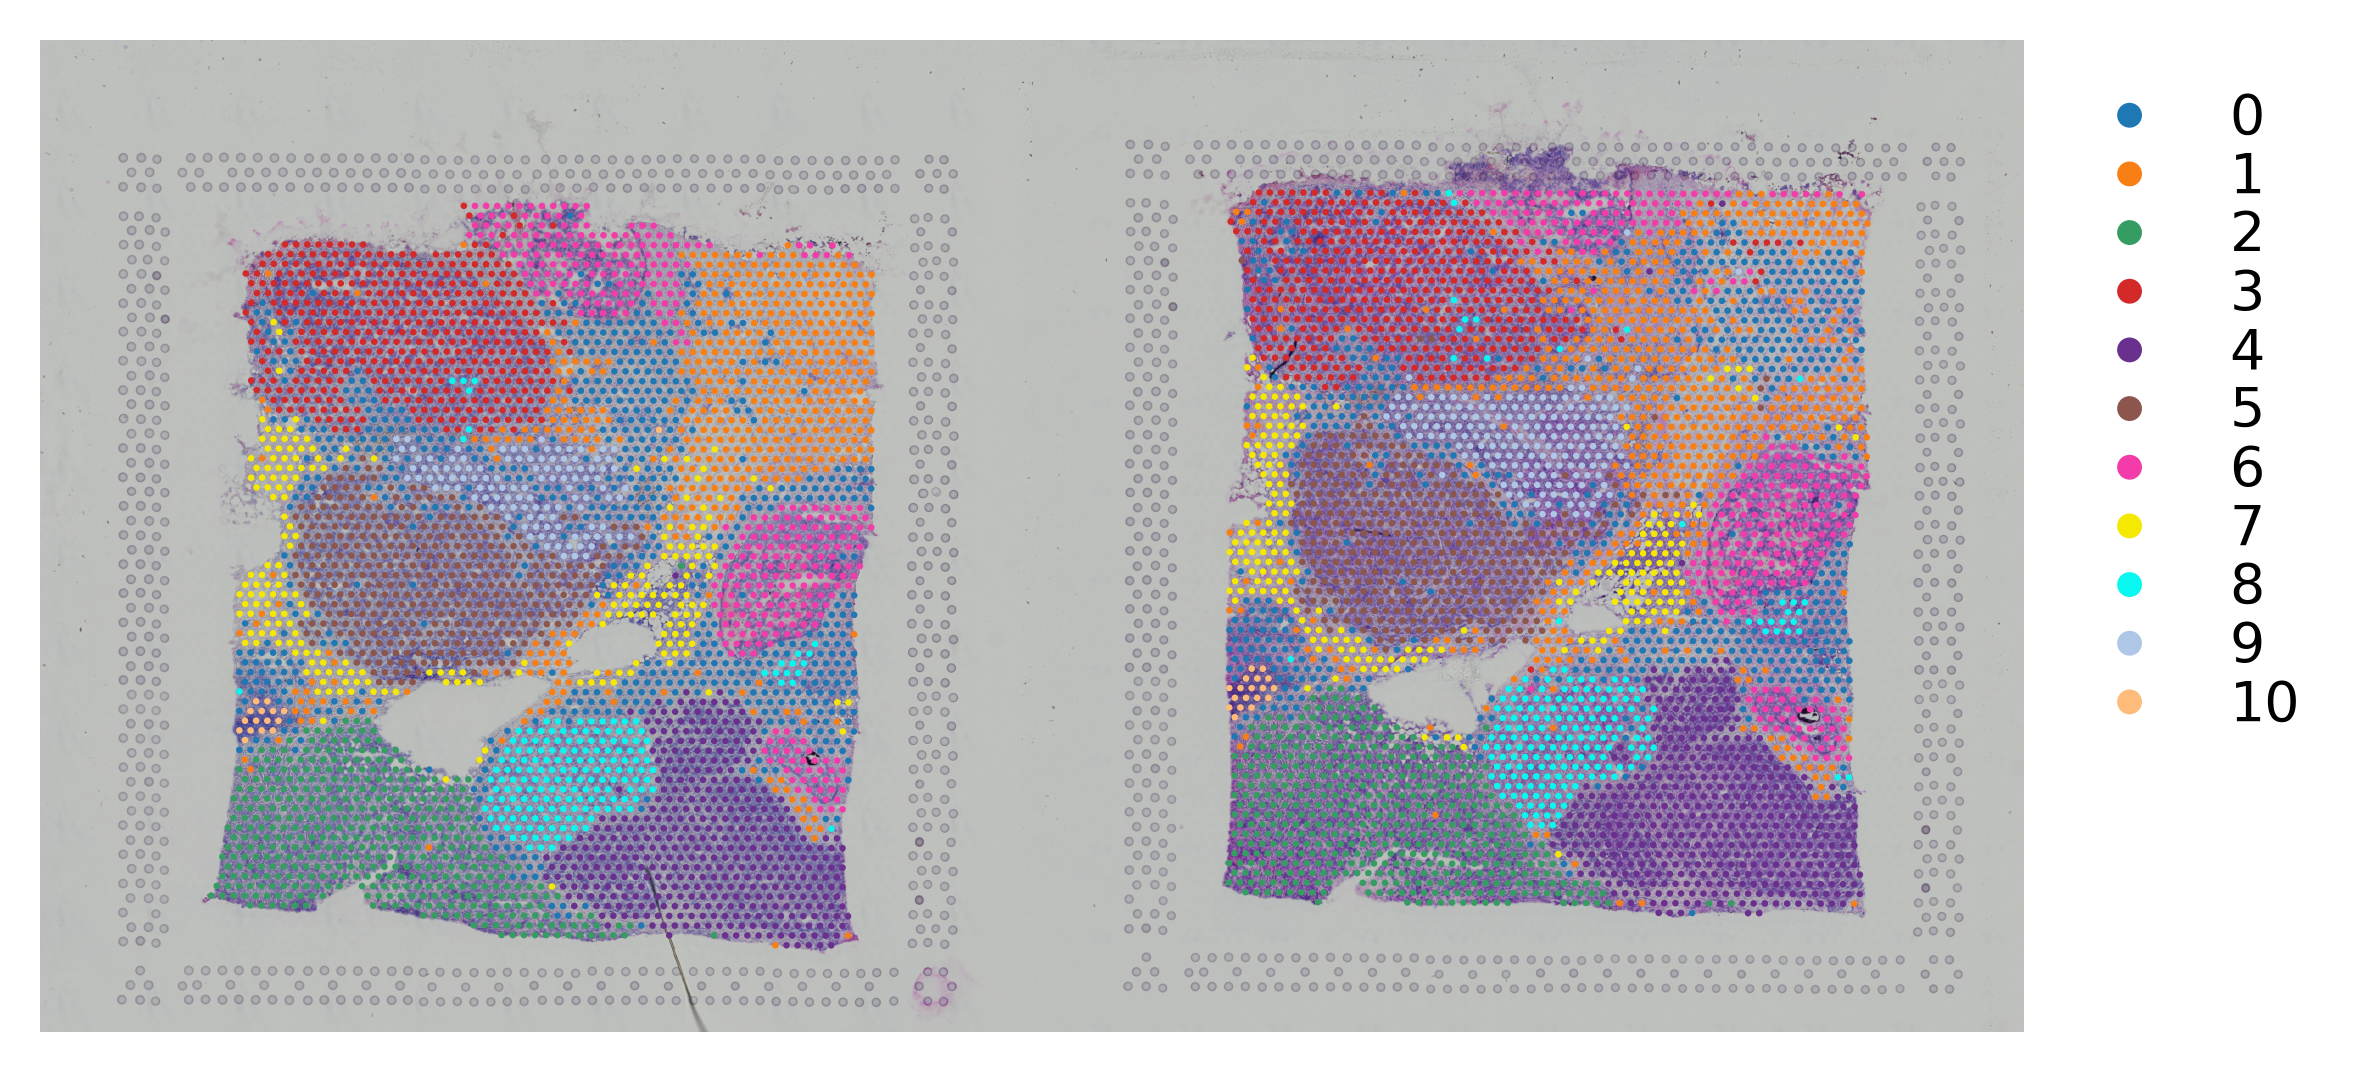
[24]:
# Plot the clusters
st.pl.cluster_plot(adata_concat, use_label="leiden", crop=False, size=1.4,cell_alpha=1)
[24]:
AnnData object with n_obs × n_vars = 7785 × 3018
    obs: 'in_tissue', 'array_row', 'array_col', 'imagecol', 'imagerow', 'batch', 'leiden'
    var: 'gene_ids', 'feature_types', 'genome', 'n_cells', 'highly_variable', 'means', 'dispersions', 'dispersions_norm', 'mean', 'std'
    uns: 'log1p', 'hvg', 'pca', 'neighbors', 'umap', 'leiden', 'batch_colors', 'leiden_colors', 'spatial'
    obsm: 'spatial', 'X_pca', 'X_umap'
    varm: 'PCs'
    obsp: 'distances', 'connectivities'